This command adds an axis to the plot, after reading this MATLAB axis topic, you will know the theory, and examples, and you will understand how to use it in MATLAB.
Syntax:
axis([xmin,xmax,ymin,ymax])
Here, the limits of the x-axis (xmin, xmax) and y-axis (ymin, and ymax).
Example:
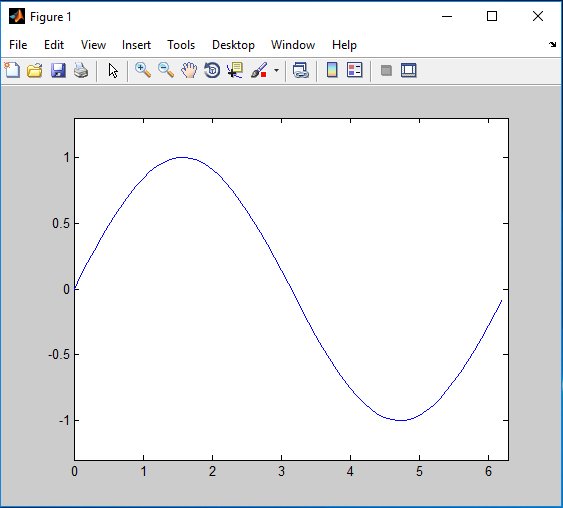
The statement to plot sine wave in MATLAB is given as
x=0:0.1:2*pi;
y=sin(x);
plot(x,y)
Output:

Change the x-axis limits 0 to 2π, and y-axis limits -1.2 to 1.2.
x=0:0.1:2*pi;
y=sin(x);
plot(x,y)
axis([0,2*pi,-1.3,1.3])

Related Topics
MATLAB ylabelThe ylabel command put the label on the y-axis of the plot, after reading this…
MATLAB xlabelThe xlabel command put the label on the x-axis of the plot, after reading this…
MATLAB titletitle() command puts the title on the plot, after reading this MATLAB title topic, you will…
MATLAB linspacelinspace( ) command or function creates a row vector with elements that are linearly (equally)…
MATLAB gridThis command adds or removes grid lines to the plot, after reading this MATLAB grid topic,…

