This command adds or removes grid lines to the plot, after reading this MATLAB grid topic, you will know the theory, and examples, and you will understand how to use it in MATLAB.
Syntax:
grid on
grid off
Here,
- grid on command, adds grid to the plot
- grid off command to remove grid from the plot
Example:
The statement to plot a sine wave in MATLAB is given as
x=0:0.1:2*pi;
y=sin(x);
plot(x,y)
Output:

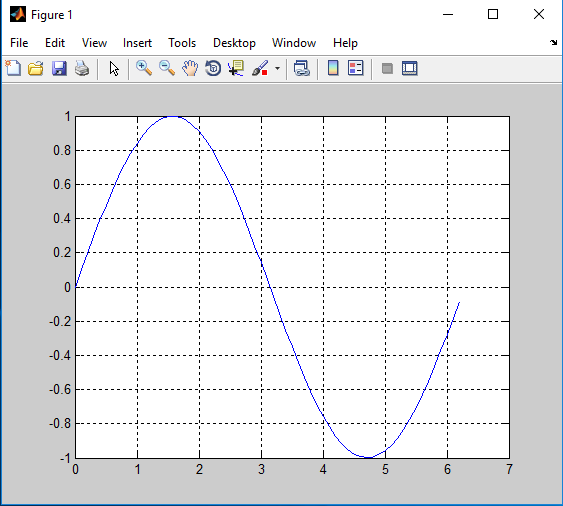
Adding the grid to the plot,
x=0:0.1:2*pi;
y=sin(x);
plot(x,y)
grid on
Removing the grid from the plot,
x=0:0.1:2*pi;
y=sin(x);
plot(x,y)
grid on
grid off
Output: