The xlabel command put the label on the x-axis of the plot, after reading this MATLAB xlabel topic, you will know the theory, and examples, and you will understand how to use it in MATLAB.
Syntax:
xlabel(‘text’)
Example:
The statement to plot sine wave in MATLAB is given as
x=0:0.1:2*pi;
y=sin(x);
plot(x,y)
Output:

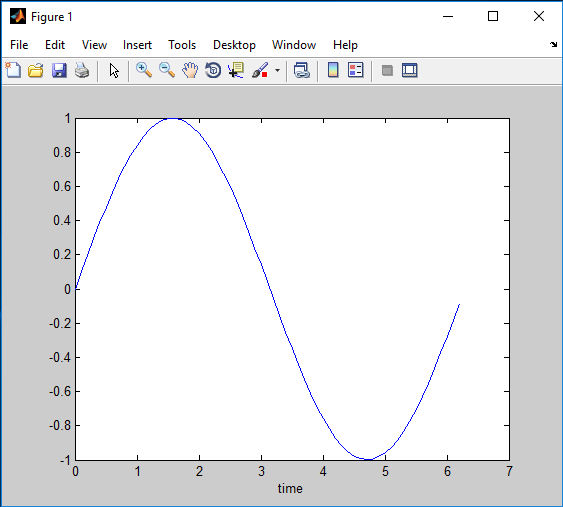
Adding x-axis label “time”, to the plot,
x=0:0.1:2*pi;
y=sin(x);
plot(x,y)
xlabel('time')
Output:
Related Topics
MATLAB axisThis command adds an axis to the plot, after reading this MATLAB axis topic, you will know the…
MATLAB ylabelThe ylabel command put the label on the y-axis of the plot, after reading this…
MATLAB titletitle() command puts the title on the plot, after reading this MATLAB title topic, you will…
MATLAB linspacelinspace( ) command or function creates a row vector with elements that are linearly (equally)…
MATLAB onesThis command creates an array of all ones, after reading this MATLAB ones topic, you…