After reading the MATLAB plots topic, you will understand how to create plots, and you will know how to use various plot commands in MATLAB.

Plots are useful in providing information in picture view and MATLAB provides the facility for creating a plot using plot command.
plot Command
The plot command in MATLAB help to create two-dimensional plots. The general form of the command is:
plot(x,y,‘line specifiers’)
| Line specifiers | Style (color) | Line specifiers | Style (marker) | Line specifiers | Style (line) |
|---|---|---|---|---|---|
| b | Blue | s | Rectangle marker | -- | Dashed line |
| c | Cyan | o | Circle | : | Dotted line |
| k | Black | x | x-mark | -. | Dashpot |
| g | Green | + | Plus | (no line) | None |
| y | Yellow | * | Star | - | Solid line |
| w | White | d | Diamond | ||
| m | Magenta | . | Point marker | ||
| r | Red |
where
- x and y both are vectors.
- The table below shows the following line specifiers which are Optional.
Examples
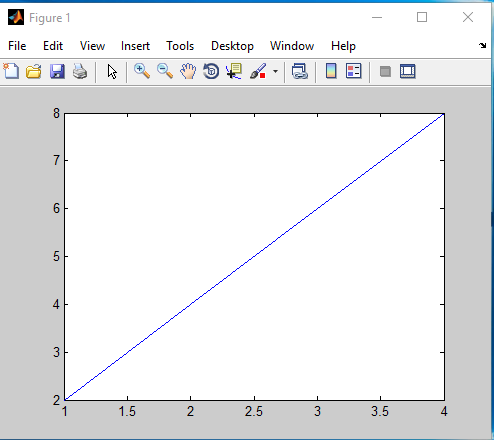
Program (1): To plot the curve for x and y values are given below, in MATLAB.
x=(1,2,3,4); y=(2,4,6,8)
x=[1 2 3 4];
y=[2 4 6 8];
plot(x,y)
MATLAB VIEW – Program (1):
Create a script file in MATLAB and type the following code –

MATLAB VIEW – Output (1):
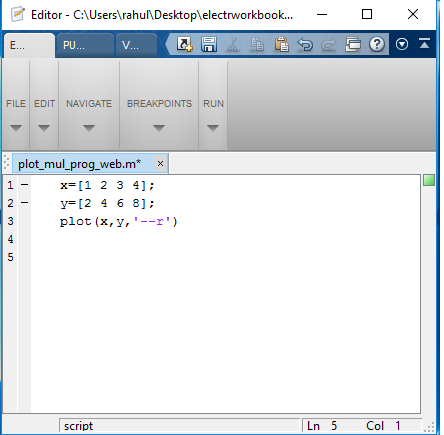
Program (2): To plot curve with a line specifiers as a dashed red line for x and y values are given below, in MATLAB.
x = (1,2,3,4); y = (2,4,6,8).
x=[1 2 3 4];
y=[2 4 6 8];
plot(x,y,’--r’)
MATLAB VIEW – Program (2):
Create a script file in MATLAB and type the following code –
MATLAB VIEW – Output (2):
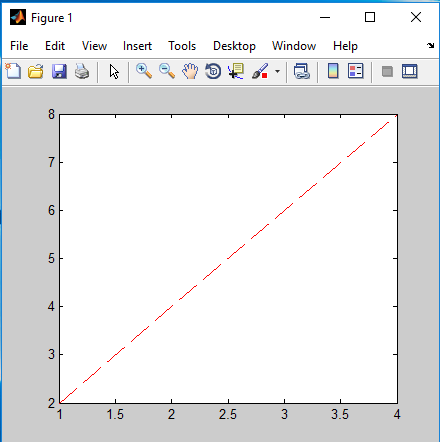
In the above plot x vs. y, with a dashed red line.
Multiple graphs using plot command
The example below will show you how to show multiple graphs in the same plot using plot command in MATLAB.
Examples
Program (1): To show curve in same plot for functions f(x) and g(x) is given below in MATLAB.
f(x) = x; g(x) = 2x; 0 ≤ x ≤ 10
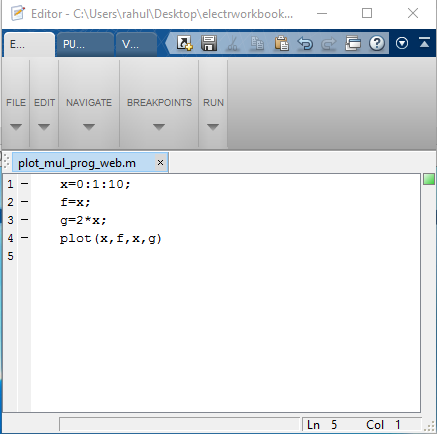
x=0:1:10;
f=x;
g=2*x;
plot(x,f,x,g)
MATLAB VIEW – Program (1):
Create a script file in MATLAB and type the following code –
MATLAB VIEW – Output (1):
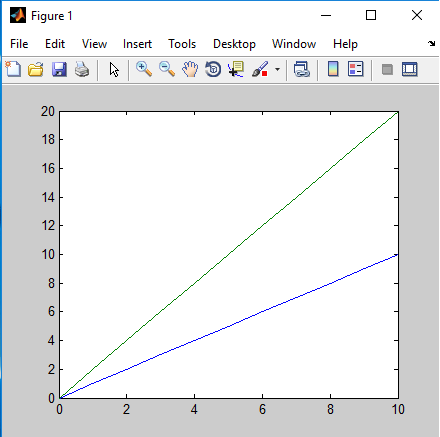
In the above figure f vs. x and g vs. x, all in the same plot.
hold on and hold off command
The example below will show you how to show multiple graphs in the same plot by using hold on and hold off command in MATLAB.
Example
Program (1): To show the curve for functions f(x) and g(x) in the same plot is given below, in MATLAB.
f(x)=x; g(x)=2x; 0≤x≤10
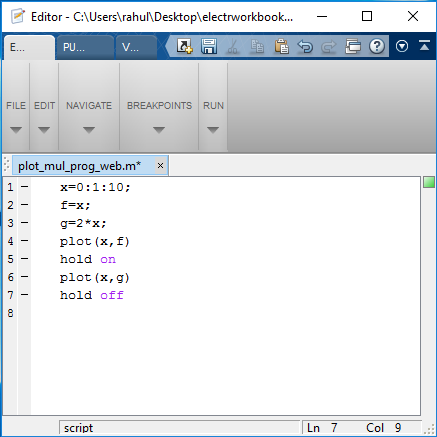
x=0:1:10;
f=x;
g=2*x;
plot(x,f)
hold on
plot(x,g)
hold off
MATLAB VIEW – Program (1):
Create a script file in MATLAB and type the following code –
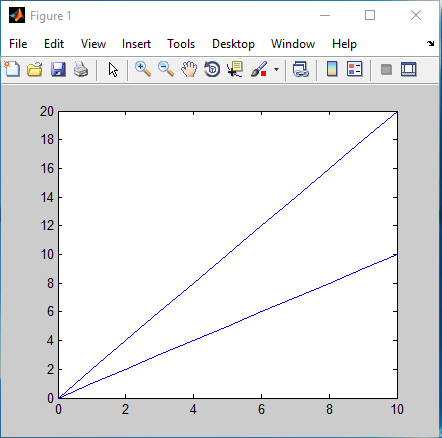
MATLAB VIEW – Output (1):
MATLAB – Plot formatting Using Commands:
The formatting commands are entered after the plot command. In MATLAB the various formatting commands are:
(1). The xlabel and ylabel commands:
The xlabel command put a label on the x-axis and ylabel command put a label on y-axis of the plot.
The general form of the command is:
xlabel(‘text as string’)
ylabel(‘text as string’)
(2). The title command:
This command is used to put the title on the plot. The general form of the command is:
title(‘text as string’)
(3). The axis command:
This command adds an axis to the plot. The general form of the command is:
axis
(4). The grid command:
This command adds the grid to the plot. The general form of the command is:
grid on
Example
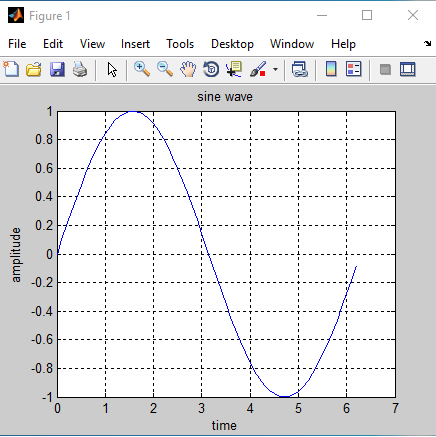
Program (1): To plot sine wave having following properties given below, in MATLAB.
f(x) = sin(x); 0 ≤ x ≤ 2π; Properties: Sine wave: axis and grid present, x-axis label “time”, y-axis label “amplitude”, title label” sine wave”.
x=0:0.1:2*pi;
y=sin(x);
plot(x,y)
xlabel('time')
ylabel('amplitude')
title('sine wave')
axis
grid on
MATLAB VIEW – Program (1):
Create a script file and type the following code –

MATLAB VIEW – Output (1):