After reading the MATLAB 3-D plots topic, you will understand how to create 3-d plots as a surface plot or mesh plot in MATLAB.

3-D plots are useful to present data having more than two variables. The command plot3(x,y,z) in MATLAB help to create three-dimensional plots. The general form of the command is:
plot3(x,y,z,‘line specifiers’)
where,
- x,y, and z are vectors of equal size.
- line specifiers which are Optional.
The example below will show you how to use plot command in MATLAB.
Examples
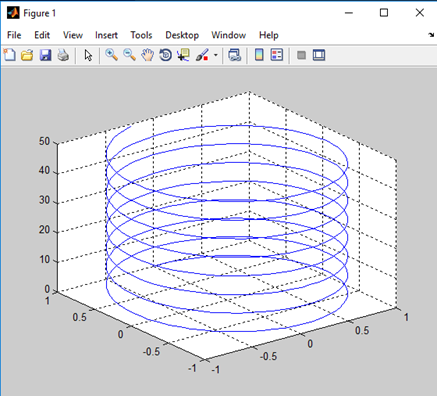
Aim(1): To plot a curve for variables x, y and z as the function of time t lies between 0 to 50 sec. i.e. (0 ≤ t ≤ 50); x = sin(t); y = cos(t).
Program (1):
Create a script file in MATLAB and type the following code –
x=sin(t); y=cos(t); z=t;
t=0:0.1:50;
x=sin(t);
y=cos(t);
z=t;
plot3(x,y,z)
grid on
MATLAB VIEW – Output (1):
Mesh and Surface Plots
Mesh and surface plots are 3-D plots. They plot a graph over the functions in the form of z = f(x,y), where x and y are the independent variables and z is the dependent variable.
Mesh Plot
The general form of the mesh command is:
mesh(x,y,z)
The example below will show you how to create a mesh plot in MATLAB.
Examples
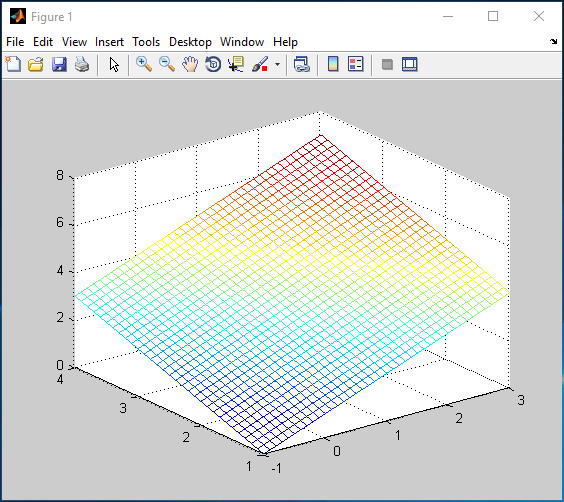
Aim(1): To make a mesh plot of the function z=x+y, over the domain
–1 ≤ x ≤ 3 and 1 ≤ y ≤ 4.
Program (1):
x=-1:0.1:3;
y=1:0.1:4;
[X,Y]=meshgrid(x,y);
Z=X+Y;
mesh(X,Y,Z)
Output (1):
Explanation:
- statements x=-1:0.1:3; and y=1:0.1:4; are used to create two vectors x and y.
- statement [X,Y]=meshgrid(x,y); used to transforms the domain specified by two vectors x and y, into matrices X and Y.
- Then, the matrices X and Y are evaluated in function Z=X+Y.
- statement mesh(X,Y,Z) generates the mesh plot of the function.
Surface Plot
The surface plot only colors the mesh surface. The general form of the mesh command is:
surface(x,y,z)
The example below will show you how to create the surface plot in MATLAB.
Examples
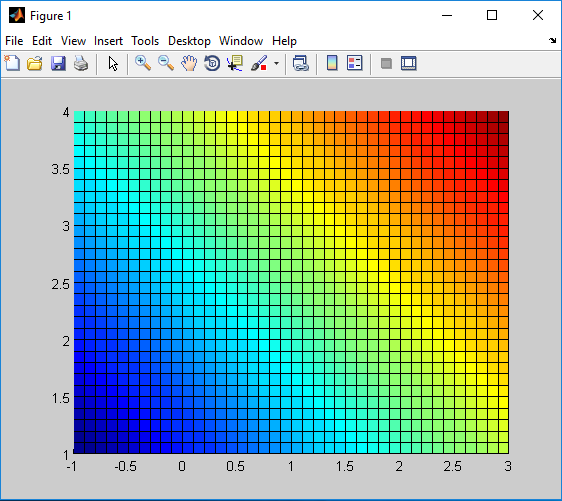
Aim(1): To make a surface plot of the function z=x+y, over the domain
–1 ≤ x ≤ 3 and 1 ≤ y ≤ 4.
Program (1):
x=-1:0.1:3;
y=1:0.1:4;
[X,Y]=meshgrid(x,y);
Z=X+Y;
surface(X,Y,Z)
Output (1):
Explanation:
- statements x=-1:0.1:3; and y=1:0.1:4; are used to create two vectors x and y.
- statement [X,Y]=meshgrid(x,y); used to transforms the domain specified by two vectors, x and y, into matrices X and Y.
- Then, the matrices X and Y are used in function Z=X+Y evaluation.
- statement surface(X,Y,Z) colors the mesh surface and generates the surface plot.