In this topic, you study B-H Curve or Magnetization Curve – Definition, Diagram & Theory.
Consider the test piece of the magnetic material made up in the form of a ring (C) with across-section ‘a’ square metres and a mean length of magnetic path ‘l‘ metres. Let the ring be wound uniformly with N turns of insulated wire. Connect the terminals of the winding to a battery (E) through a variable resistance (R) as shown in Fig. 1.
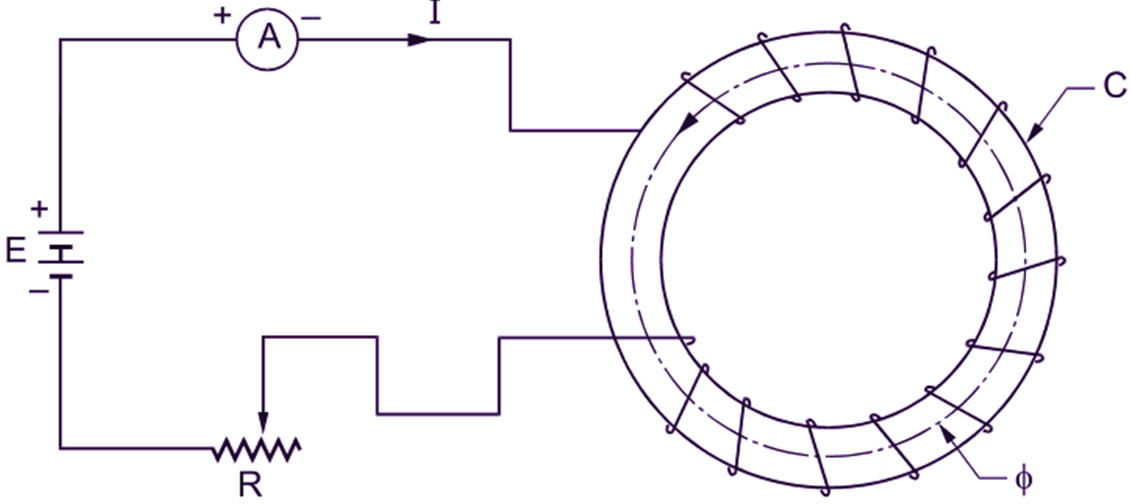
Fig. 1: Determination of the magnetization curve for the magnetic material
Gradually reduce the resistance R so as to increase the current in the winding from zero to some maximum value. Measure the flux (it)) for different values of the exciting Current (I) by means of some special instruments like flux meter or ballistic galvanometer (not shown). Plot the values of flux density B (given by Φ / a) against corresponding values of the magnetic field strength H (given by NI / l). Then a graph as shown in Fig. 2 (a) is obtained.
This graph between flux density (B) and magnetic field strength (H) for the magnetic materialis called its magnetization or B-H curve.
It has already been mentioned previously that in air and all other non-magnetic materials, the magnetic flux density is found to be always directly proportional to the magnetic field strength responsible for producing it. Therefore, obviously, the magnetization curve is a straight line passing through the origin (Fig. 2 b). That is not the case with magnetic materials. The typical magnetization curve for the magnetic material shown in Fig. 2 (a) clearly indicates the non-linear relation between the flux density and the magnetic field strength. At very low values of the magnetic field strength, the flux density at first does not increase rapidly as represented by an initial bend in the curve. Following this initial bend, the flux density increases rapidly as the magnetic field strength is increased until the curve again bends over. The point C where this bend in the curve is pronounced is known as knee of the B-H curve. Beyond this knee, the increase in flux density is less marked.
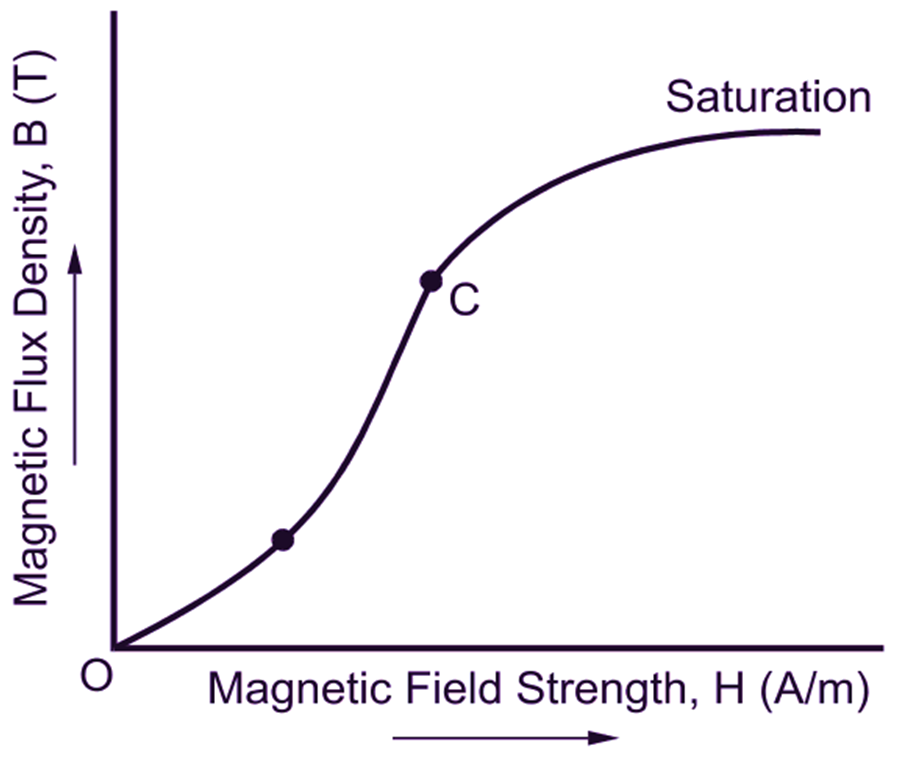
(a)
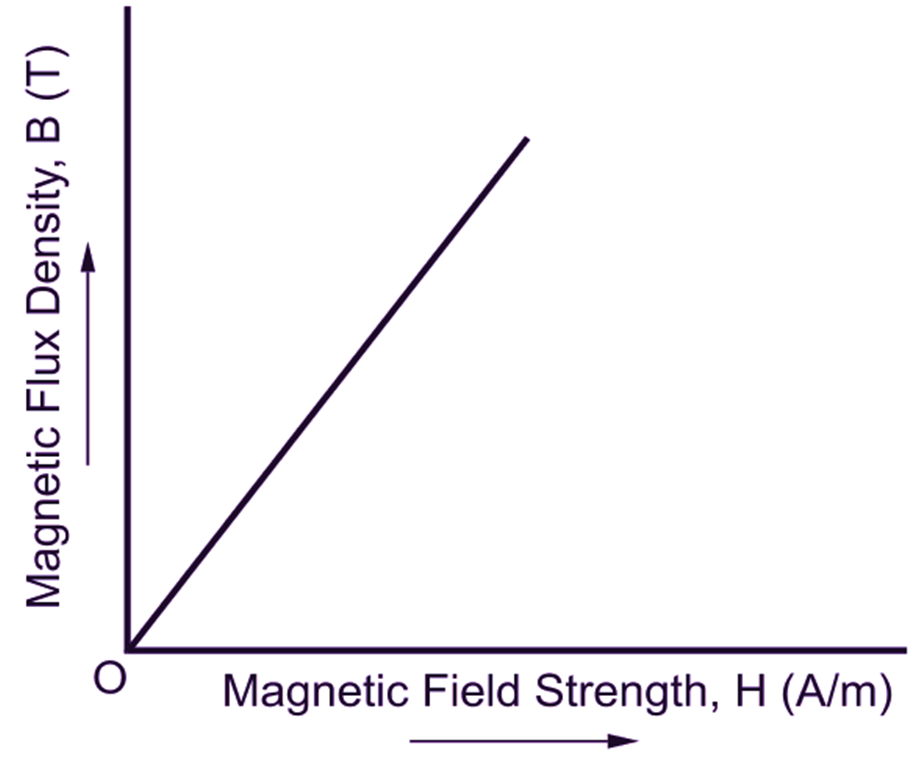
(b)
Fig. 2: Typical magnetization curves for (a) Magnetic material, (b) Non-magnetic material
Ultimately, increasing the magnetic field strength makes very little change in the flux density and the magnetic material is said to be saturated. The term magnetic saturation is only relative. It simply means that to produce small increase in the flux density, an altogether disproportionately large increase in magnetic field strength is necessary. All magnetic materials exhibit this phenomenon of magnetic saturation. The magnetization curves are, therefore, often called saturation curves.
Magnetization Curve and Relative Permeability
Since,
\[\text{B = }{{\text{ }\!\!\mu\!\!\text{ }}_{\text{o}}}\text{ }{{\text{ }\!\!\mu\!\!\text{ }}_{\text{r}}}\text{ H}\]
\[{{\text{ }\!\!\mu\!\!\text{ }}_{\text{r}}}\text{ = }\frac{\text{B}}{{{\text{ }\!\!\mu\!\!\text{ }}_{\text{o}}}\text{ H}}….(1)\]
${{\text{ }\!\!\mu\!\!\text{ }}_{\text{o}}}$ in the above expression being a constant having the value of 4π × 10-7, it is obvious that the slope of B-H curve at a particular point decides the value of the relative permeability of the magnetic material corresponding to the flux density given by the ordinate at that point. Steeper the slope of the magnetization curve, greater is the relative permeability.
Using the relationship given by Equation (1), relative permeability may be plotted as a function of flux density as shown in Fig. 3.
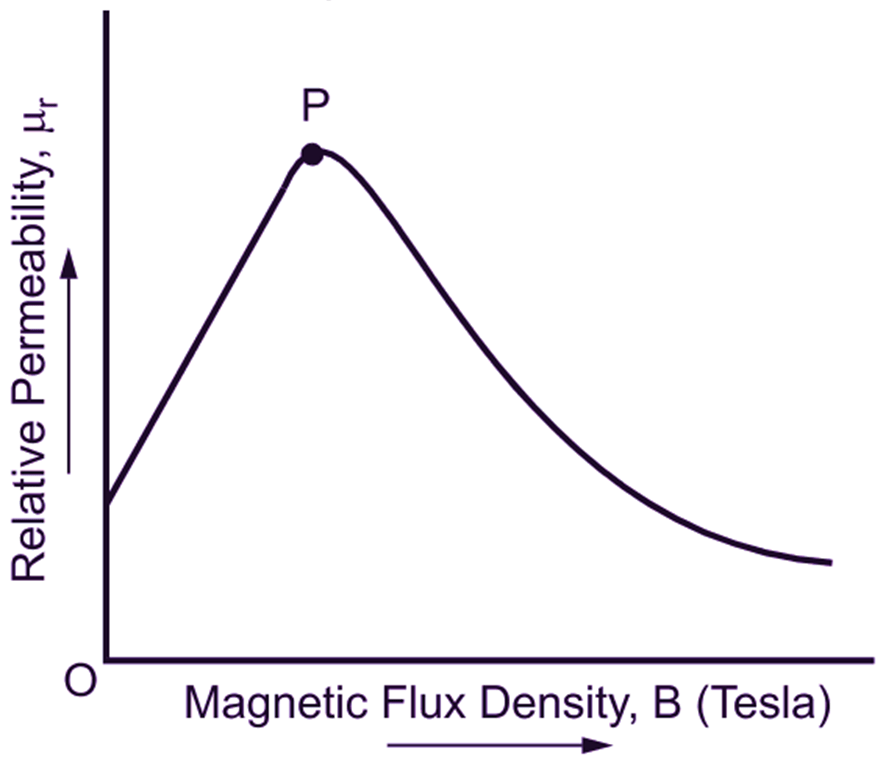
Fig. 3: Permeability characteristic of the magnetic material
The graph shows how the relative permeability actually varies with the flux density. Starting from a comparative y modest value at B = 0, the relative permeability increases to a maximum at point P. Beyond this point, it falls off fairly rapidly as the material saturates, as shown. In addition to the flux density, relative permeability depends upon the quality of the magnetic material and, the mechanical and heat treatments to which it is subjected. In general, lesser the impurities (like sulphur, carbon and phosphorus) in the iron, better is its permeability.
Practical Importance of Magnetization Curves
The magnetic properties of iron, steel and their alloys are generally shown by means of magnetization curves. The permeability curves of the magnetic materials can a so be derived from their magnetization curves as already seen above. All these curves are most useful in making magnetic calculations in the design or analysis of the magnetic circuits. For example, the computation of the magnetomotive force necessary to produce some desired value of flux is generally made using magnetization curves. These curves also help in selecting the magnetic material for a particular application.