Block diagram is a pictorial representation of a control sytem. Each element is represented by a separate block and each block is characterised by transfer function of the element. Let us consider element of a control system having transfer function G(s). If the input and output of element are X(s) and Y(s) respectively, then this element is represented by a block as shown in Fig. 1.
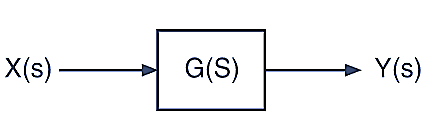
Fig. 1: Representation of an taken out of the block.
Input X(s) is given to the block by a straight line with an arrow head and output Y(s) by another is taken out of the block by another st. line with arrow head as indicated in the figure. The output Y(s) is the product of input X(s) and transfer function G(s) of the block and is given by equation
Y(s) = G(s) X(s)
Similarly block for each element of control system are developed and they are interconnected to obtain the block diagram of the control system. For the connection of blocks, the following constituents are used.
Summing Point
It is represented by a circle with a cross inside it. It is used when two signals are to be added or subtracted (+) sign near arrow head indicates addition of signal and (-) sign indicates subtraction of signal are shown in Fig. 2.
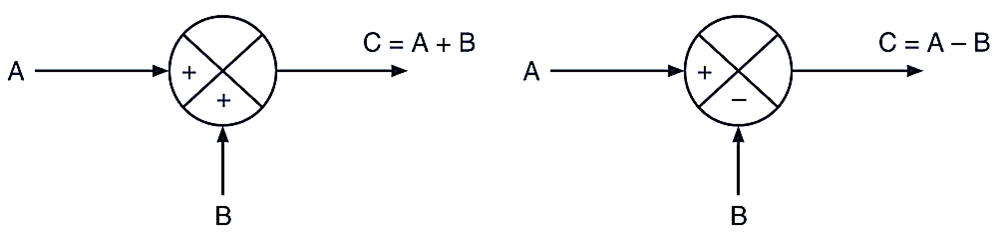
Fig. 2. Summing point.
Take Off Point
If the input signal goes to more than one point in the block diagram, then a take off point is used as shown in Fig. 3.
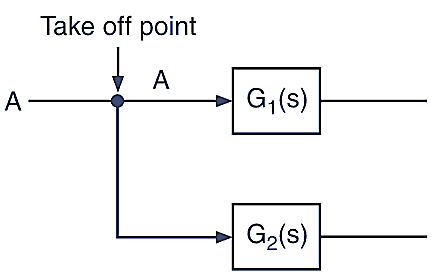
Fig. 3. Take off point.
Branch Point
If the input from a block goes to more than one point, then a branch point is used as shown in Fig. 4.
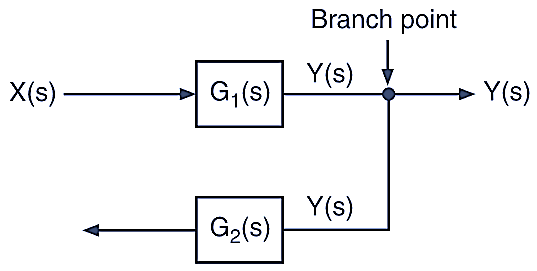
Fig. 4. Branch point.
Thus, overall transfer function is product of individual transfer function.
Cascade Connection
When a number of blocks are connected in series so that output of one block goes to the input of next block, then this connection is called cascade connect. It is shown in Fig. 5.
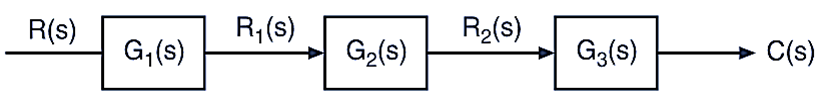
Fig. 5. Cascade connection.
R1(s) = G1(s) . R1(s)
R2(s) = G1(s) . R1(s)
= G1(s) G2(s) R(s)
C(s) = G3(s) R2(s)
= G1(s) G2(s) G3(s) R(s)
= [G1(s) G2(s) G3(s)] R(s)
Thus, over all transfer function is product of individual transfer function.
Parallel Connection
If input is given to different blocks and output is the sum of outputs then parallel connection is used as shown in the Fig. 6.
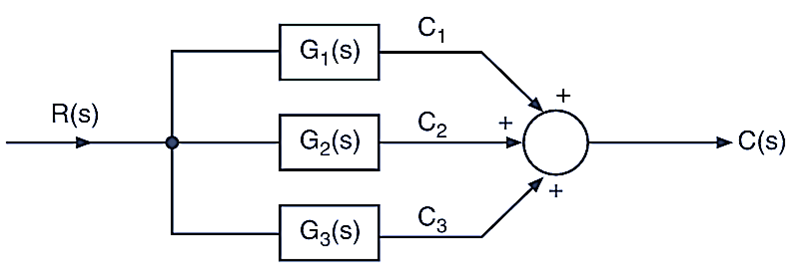
Fig. 6. Parallel connection.
C1 = R . G1(s)
C2 = R . G2(s)
C3 = R . G3(s)
C(s) = C1 + C2 + C3
= [G1(s) + G2(s) + G3(s)] R(s)
Thus in parallel connection, the over all transfer function is sum of individual transfer function of blocks.
Colonial Connection
When blocks are connected to form a closed loop then it is called colonial connection as shown in Fig. 7.
The block diagram does not represent the physical nature of a control system. Two different physical system may have same block diagram. Also, a physical system may not have a unique block diagram. It can be represented by different block diagram. However, the overall transfer function for the system is same.
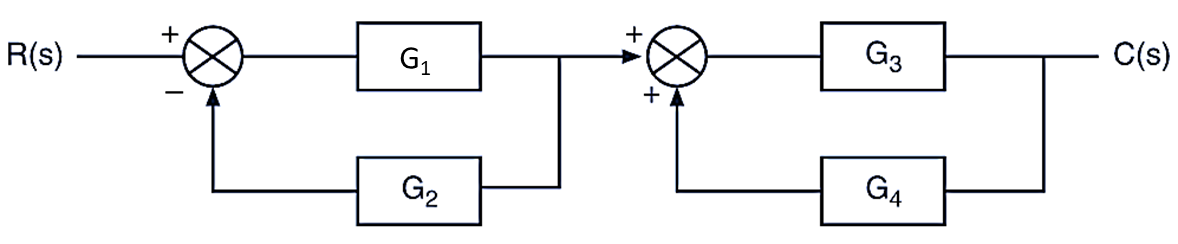
Fig. 7. Colonial connection.
Procedure for Drawing Block Diagram
The steps to be followed to draw a block diagram of a system are given below:
- Write down the differential equations representing the system.
- Find Laplace transform of these equation assuming zero initial conditions.
- Represent each equation in the form of a block.
- Interconnect these blocks to get the final block diagram.
In this step use summing point when two signals are added/subtracted. Use cascade connection when output of one block is input to other block. Similarly, parallel connection is to be followed accordingly to the situation.
Properties of Block Diagram
- Block diagram is a pictorial representation of a control system.
- It does not gives any idea about physical nature of system.
- Different analogous systems may have same block diagram.
- Block diagram of a system is not unique.
- It shows flow of signal thought out the system.
Significance of Block Diagram
- Any system like electrical mechanical, thermal, chemical, plant process control, etc., can be represented by block diagram.
- A complicated system can be represented by block diagram which can be further reduce to make it a simple diagram.
- Transfer function of the system can be easily determined from the block diagram.
- A system element can be easily added or deleted in the block diagram so as to study the behaviour of a given system in the presence or absence of the new element.