The diagram in which different alternating quantities (sinusoidal) of the same frequency are represented by phasors with their correct phase relationships is known as a phasor diagram.
The phasors representing different alternating quantities of the same frequency rotate in an anti-clockwise direction with the same angular velocity (ω = 2πf). As such they maintain a fixed position relative to each other. Therefore, a phasor diagram can be considered as a still picture of these phasors in one particular position.
As an example, let us consider the case of the e.m.f.s in two single-turn coils A and B shown in Fig. 1.
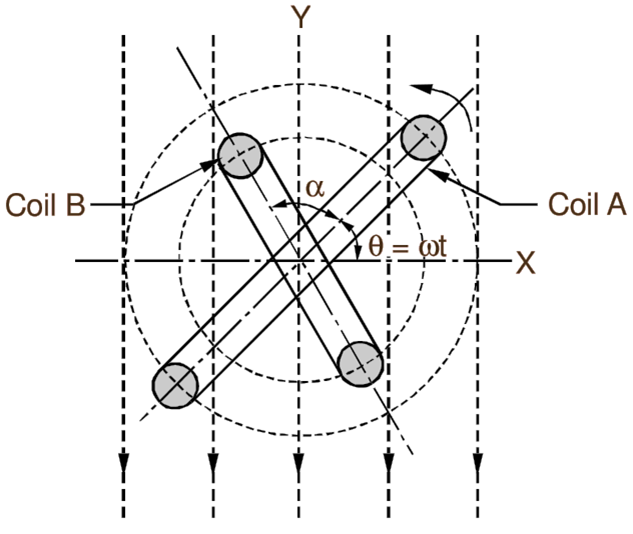
Fig. 1: Two alternating quantities.
(a)
(b)
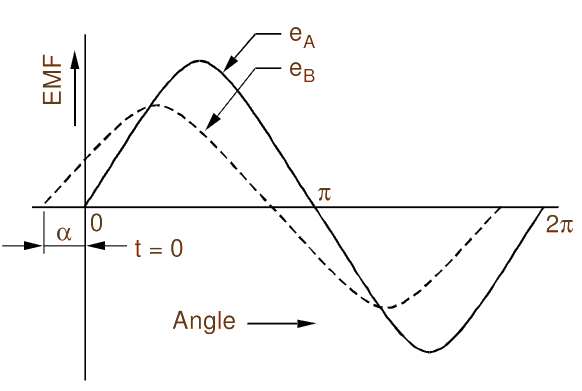
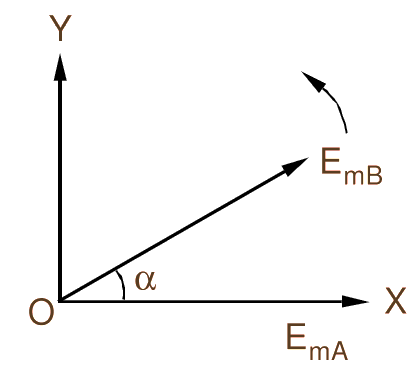
Fig. 1: Phasor diagram for two alternating quantities.
If the wave for the e.m.f. in coil A is supposed to pass upward in positive direction through zero at the instant when t = 0, then at the same instant, the wave for the e.m.f. in the coil B already attains some positive value because of its advancement through an angle a from its zero value (Fig. 2 a). This can be shown with the help of phasors in the phasor diagram as illustrated in Fig. 2 (b). The angle a between two phasors is obviously the phase difference between the two e.m.f.s.
Following few points should be noted in connection with the phasor diagrams:
- X and Y axes are fixed in space. Therefore, it is not necessary to include them in the diagram.
- The phasors are drawn normally to represent r.m.s. values.
- The phasor chosen as a reference phasor is drawn in the horizontal position (merely for convenience) e.g. the phasor EmA in Fig. 2 (b) is the reference phasor.
- Since the phasors representing different alternating quantities are assumed to rotate in the counter clockwise direction, the phasors ahead in this direction from a given phasor are said to lead the given phasor, while those behind are said to lag the given phasor. e.g. in Fig. 2 (b), the phasor EmB leads the phasor EmA by an angle α. The angle between two phasors represents the phase difference between two alternating quantities.
- In order to distinguish between different alternating quantities like current, voltage or flux, different types of arrow heads may be used. e.g. the current phasors may be drawn with closed arrow heads while the voltage phasors with open arrow heads.
In this way, when different alternating quantities of the same frequency are represented by phasors in the same phasor diagram. their addition and subtraction becomes simple. It is similar to addition and subtraction of vectors in mechanics.