Psychrometric chart is a graphical representation of the various psychrometric properties of moist air. The psychrometric chart is normal y drawn for standard atmospheric pressure of 750 mm of Hg. In a psychrometric chart, dry bulb temperature is taken as abscissa (X-axis) and specific humidity (i.e. moisture content) as ordinate (Y-axis).
Role or Advantages of psychrometric Chart
- Psychrometric chart is very useful for finding out the properties of air, which are required in the field of air conditioning.
- Computation of psychrometric properties of air-water vapour mixture using mathematical solutions is tedious and time consuming, and even the use of tables is a slow process because of the necessity of interpolation. Psychrometric chart overcomes this difficulty and eliminates lot of calculations.
- Psychrometric chart is probably the most valuable single tool available to the air conditioning engineer or design technician.
- The use of psychrometric chart permits the graphical analysis of psychrometric data and processes.
- Psychrometric chart provides solution to many practical problems dealing with air.
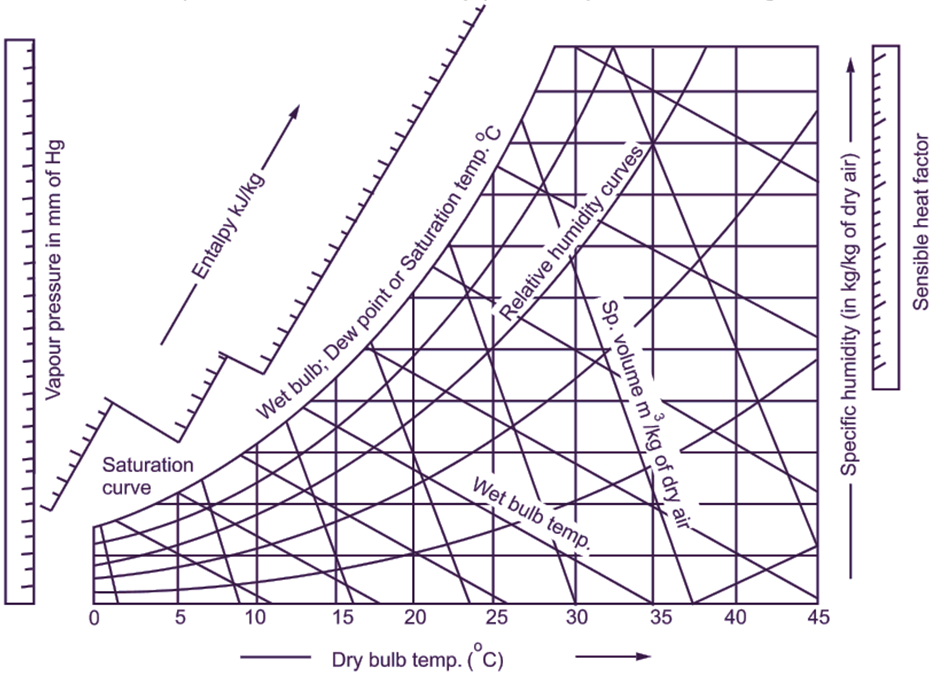
Fig. 1: Psychrometric chart
The chart in Fig. 1 shows the general construction of the psychrometric chart. The various lines or curves marked on the chart are discussed below.
Dry Bulb Temperature Lines
Vertical lines uniformly spaced and drawn parallel to Y-axis on the chart are called as dry bulb temperature lines.
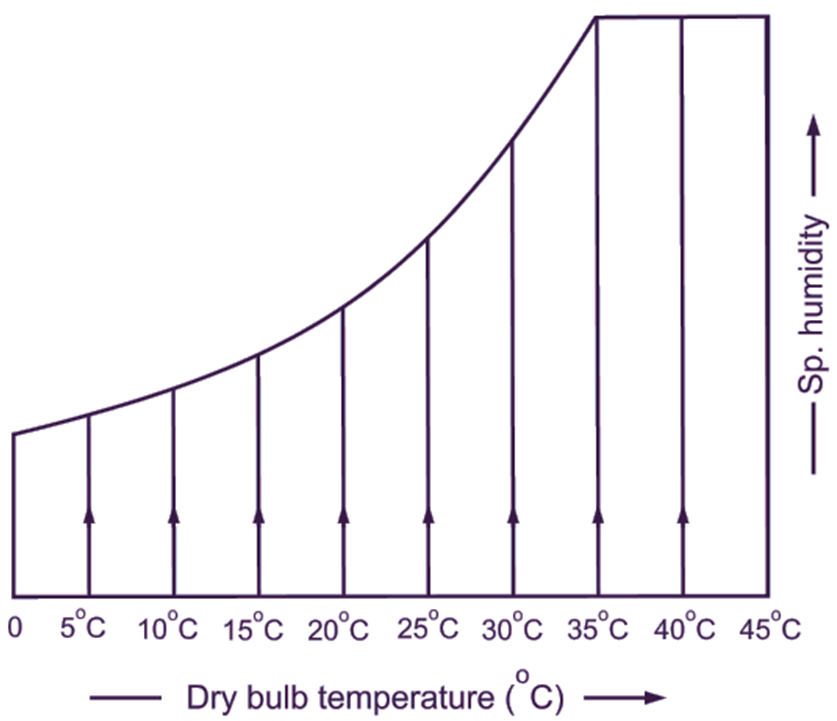
Specific Humidity Lines
Horizontal lines uniform y spaced and parallel to X-axis are called as specific humidity (moisture content) lines.
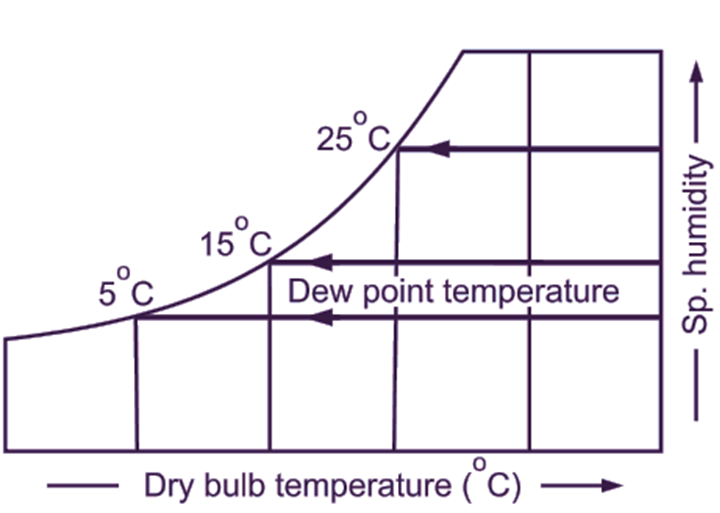
Dew Point Temperature Lines
Horizontal lines parallel to X-axis, but non-uniformly spaced are called as dew point temperature lines. Dew point temperature is read on the saturation curve. At any point on the saturation curve, both dry bulb temperature and dew point temperature are equal.
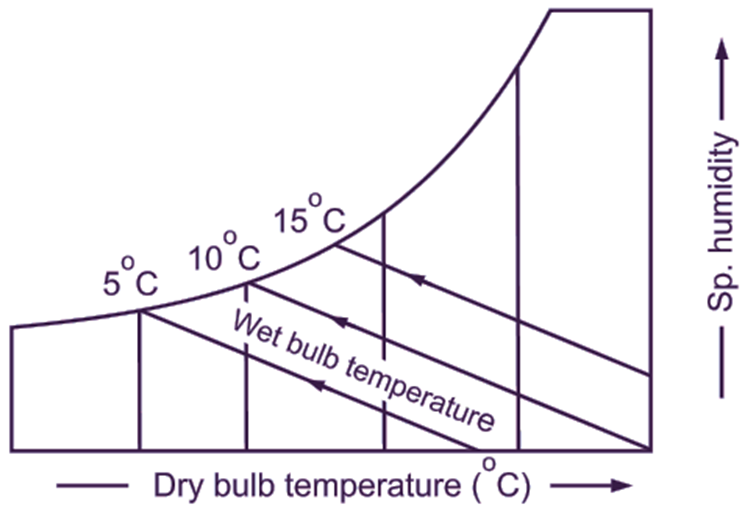
Wet Bulb Temperature Lines
The wet bulb temperature lines are the inclined straight lines (diagonal lines) and nonuniformly spaced. At any point on the saturation curve, both dry bulb and wet bulb temperature are equal.
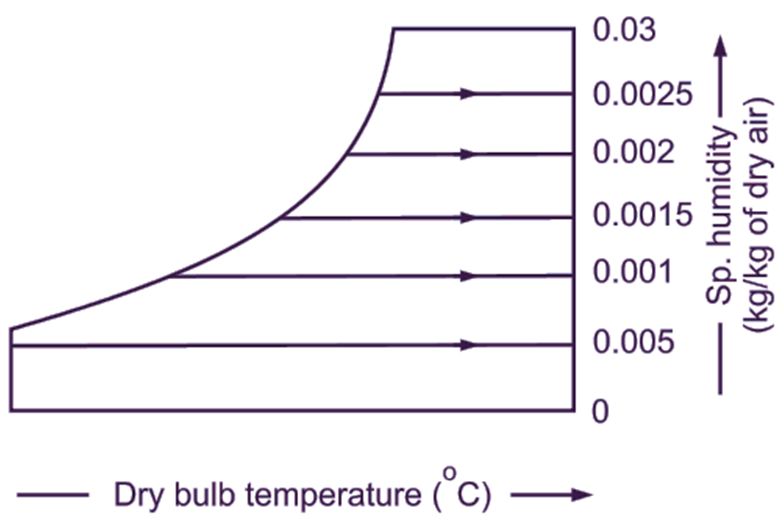
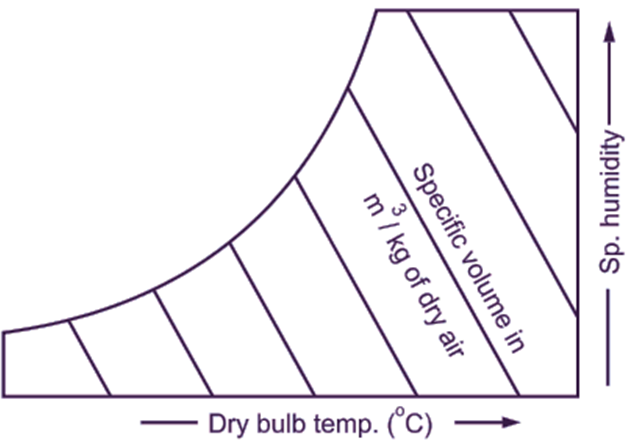
Specific Volume Lines
The obliquely inclined straight lines are the lines of constant specific volume. These lines are uniformly spaced, but widely placed. The values of specific volume are given at the base of the chart.
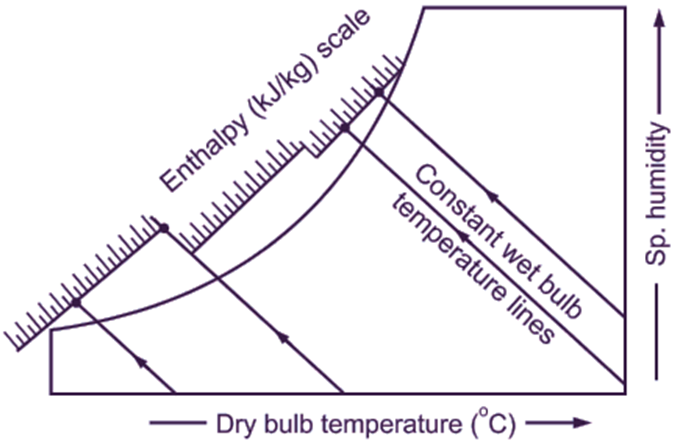
Enthalpy Lines
Enthalpy (total heat) lines are inclined straight lines (diagonal lines). These lines are uniformly spaced, parallel and also coinciding with the wet bulb temperature lines. The values of enthalpy are given on the scale provided above the saturation curve.
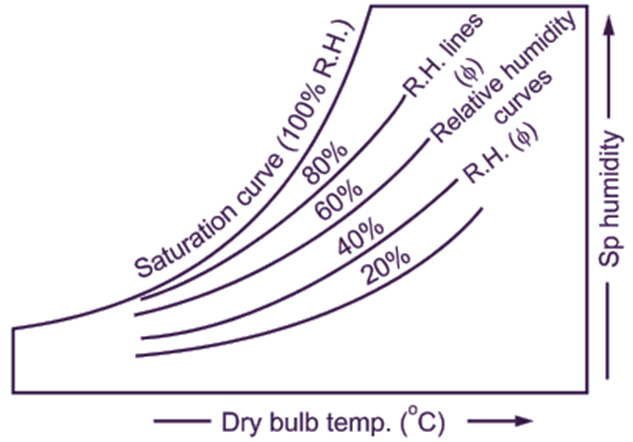
Relative Humidity Lines
They are curved lines parallel to saturation curve. Generally, these lines are drawn with values 10
Reading of Psychrometric Properties
Refer Fig. 2, where a point plotted on psychrometric chart is encircled. We can find out all the psychrometric properties by reading the actual psychrometric chart having values. Fig. 2 clearly indicates the way of finding out every psychrometry property for any point plotted reading the psychrometric chart. If any two properties of air at a condition are known, then rest of the psychrometric properties can be determined by plotting that condition of air on psychrometric chart, represented by point.
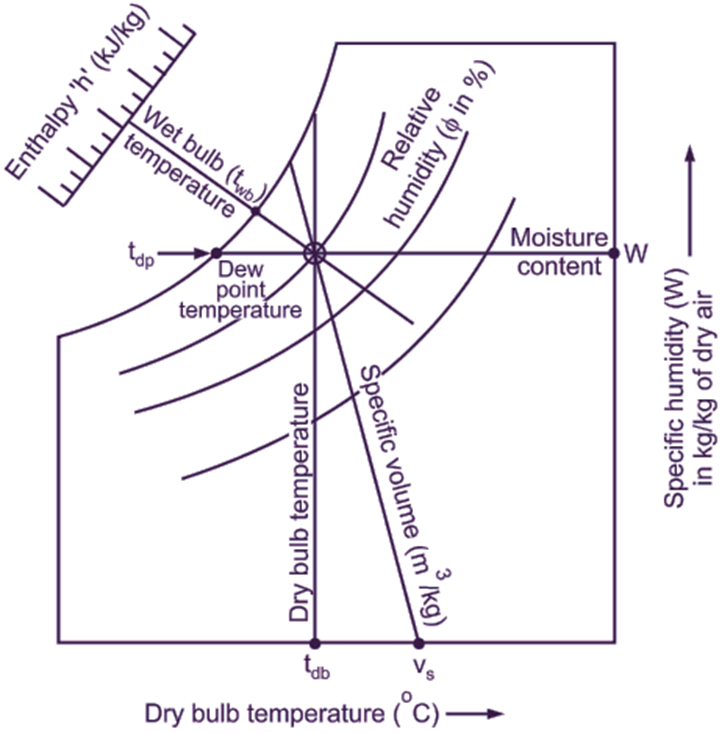
Fig. 2: Reading of psychrometric chart