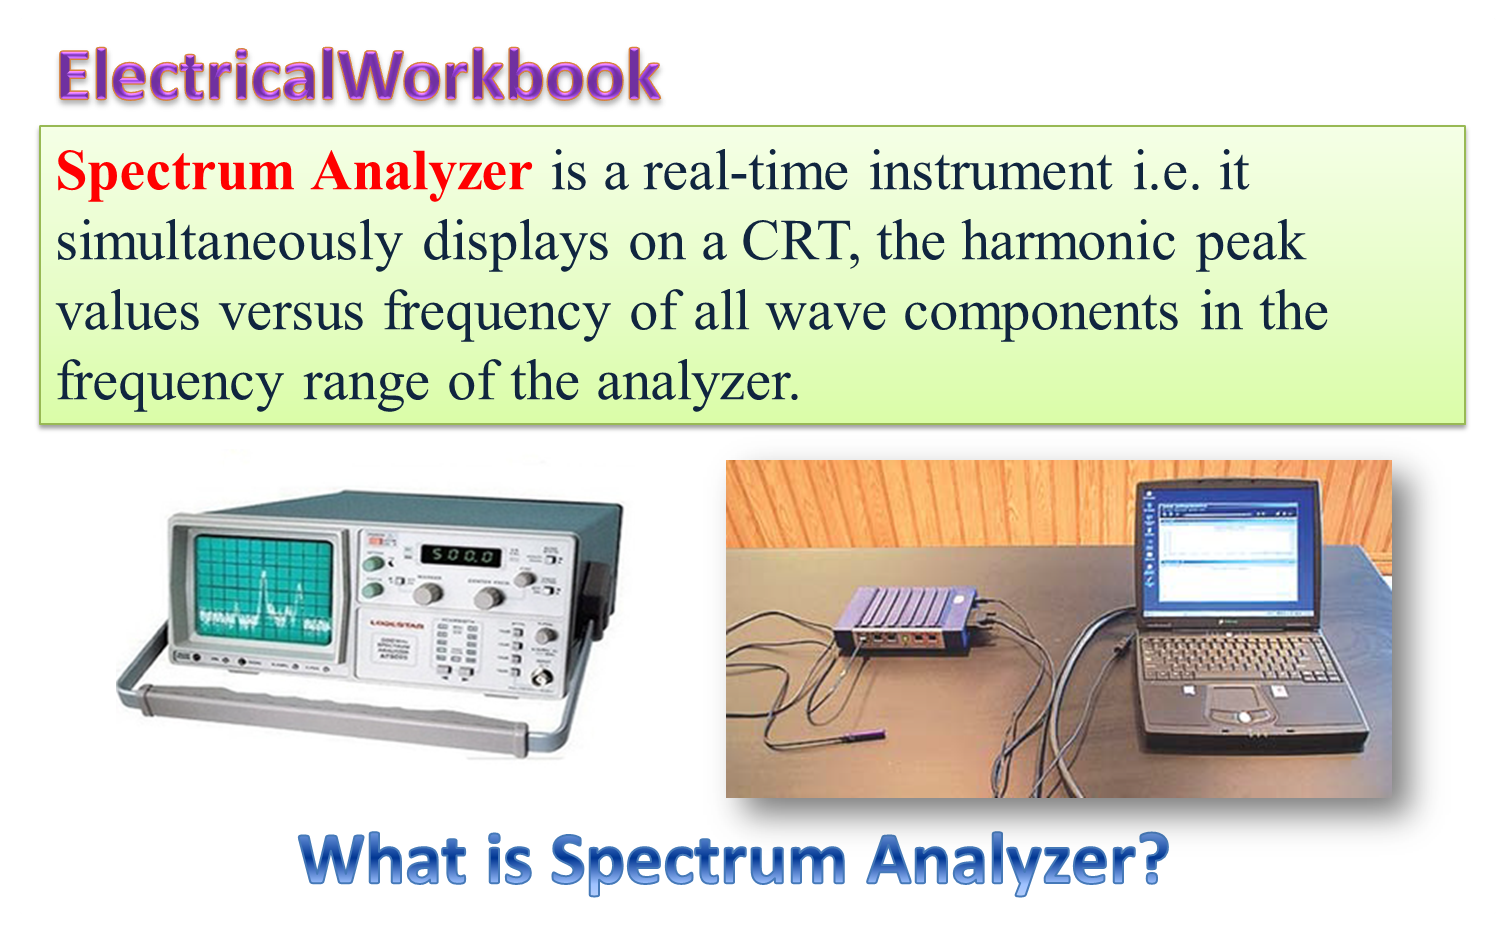
The spectrum analyzer is an instrument, which is capable to display graphically, the “amplitude as a function of frequency” in a portion of the RF spectrum and covers a frequency range of 10 MHz to 40 GHz. The instrument is widely used for the measurement of attenuation, FM deviation, and frequency in pulse modulation techniques.
The spectrum analyzer gives us the display of frequency spectrum of the input signal on a CRO screen. This display is very helpful in the analysis of any input signal; as it gives information about the location and strength of all the frequency components of the input signal.
Block Diagram of Spectrum Analyzer
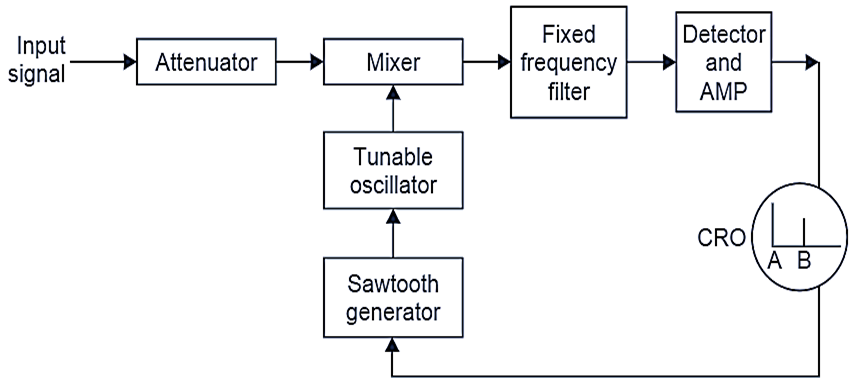
Figure 1: Block Diagram of Spectrum Analyzer.
Most spectrum analyzers operate on the principle of “Heterodyne Wave Analyzer”. The Fig. 1 shows block diagram of a basic spectrum analyzer. The input signal is passed through an attenuator and then mixed in a mixer with a signal from a variable frequency (tunable) oscillator. The mixed signal is then filtered in a fixed frequency filter. The output of the filter is then detected, amplified and supplied to the vertical deflection plates of the CRO. A sawtooth signal generator generates signal for the oscillator, and frequency of the oscillator is controlled by the instantaneous value of the sawtooth voltage.
The oscillator frequency sweeps linearly and increases from its minimum to maximum value, as the sawtooth voltage rises from its minimum to the maximum value. The same sawtooth signal is supplied to the horizontal deflection plates of the CRO. So we can say that when sawtooth signal starts to rise from its minimum value, two events occur at a time: the frequency of the oscillator starts to increase and simultaneously the spot on the CRO screen travels in the horizontal direction.
Working of Spectrum Analyzer
As the oscillator frequency increases, first of all, the fundamental frequency component i.e., harmonic of the input signal is filtered out from the fixed frequency filter. This filtered signal is then detected, amplified and supplied to the vertical deflection plates of the CRO, so the spot on the CRO screen is deflected to the left say at point A, and deflection of the spot in the vertical direction shows the amplitude of that particular frequency component.
As voltage of the sawtooth signal rises further, frequency of the oscillator increases. so second frequency component (i.e., second harmonic) is filtered out and after detection and amplification reaches to the vertical deflection plates of the CRO, the spot moves in horizontal direction towards right and say comes to point B, at this point, deflection of the spot in the vertical direction will show amplitude of the second harmonic component.
Similarly, all the harmonic components appear on the CRO screen. The scanning range of this instrument is equal to the tuning range of the oscillator.